AI Solution
AI-powered dashboards that show what’s happening and what to do next
An AI-powered dashboard brings data from all your systems into one live view, then uses AI to explain changes in plain English, spot unusual patterns and send alerts. Instead of exporting spreadsheets, managers ask questions like “Why did margin drop last week?” and get a clear answer with the numbers behind it.
Is this for you?
- Reports are built by hand in spreadsheets and are out of date when they arrive.
- Data sits in separate systems that don’t talk to each other.
- Managers see what happened, but not why, or what to do about it.
- Problems are found days or weeks late, when they are expensive to fix.
What you get
Everything needed to go from idea to results, delivered by one accountable team.
- 01
Data connections
Automatic feeds from your ERP, CRM, accounting, e-commerce and operations systems.
- 02
Live dashboards
Clean, role-based views for leaders, managers and teams on any device.
- 03
Ask-in-plain-English
Type a question and get an answer, chart and explanation in seconds.
- 04
Smart alerts
Notifications by email, Teams or WhatsApp when a number moves out of range.
- 05
Automated reports
Daily, weekly and monthly summaries written and sent automatically.
- 06
Forecasts
Simple predictions for sales, demand or cash flow based on your history.
Common use cases
Operations
Real-time status of jobs, vehicles, sites or orders in one place.
Sales and margin
Performance by product, region and rep, with explanations for changes.
Finance
Cash position, overdue invoices and spend anomalies at a glance.
Multi-location
Compare branches, outlets or stores side by side.
How it works
Clear stages, typical timings and a working result at every step.
Tools and platforms we work with
- 1
Define 1–2 weeks
Agree the decisions the dashboard must support and the measures that matter.
- 2
Connect 2–4 weeks
Link and clean data from each system into one reliable source.
- 3
Build 2–4 weeks
Design dashboards, AI questions and alerts with your team’s feedback.
- 4
Support Ongoing
Monitor data quality and add new views as needs grow.
Proof it works
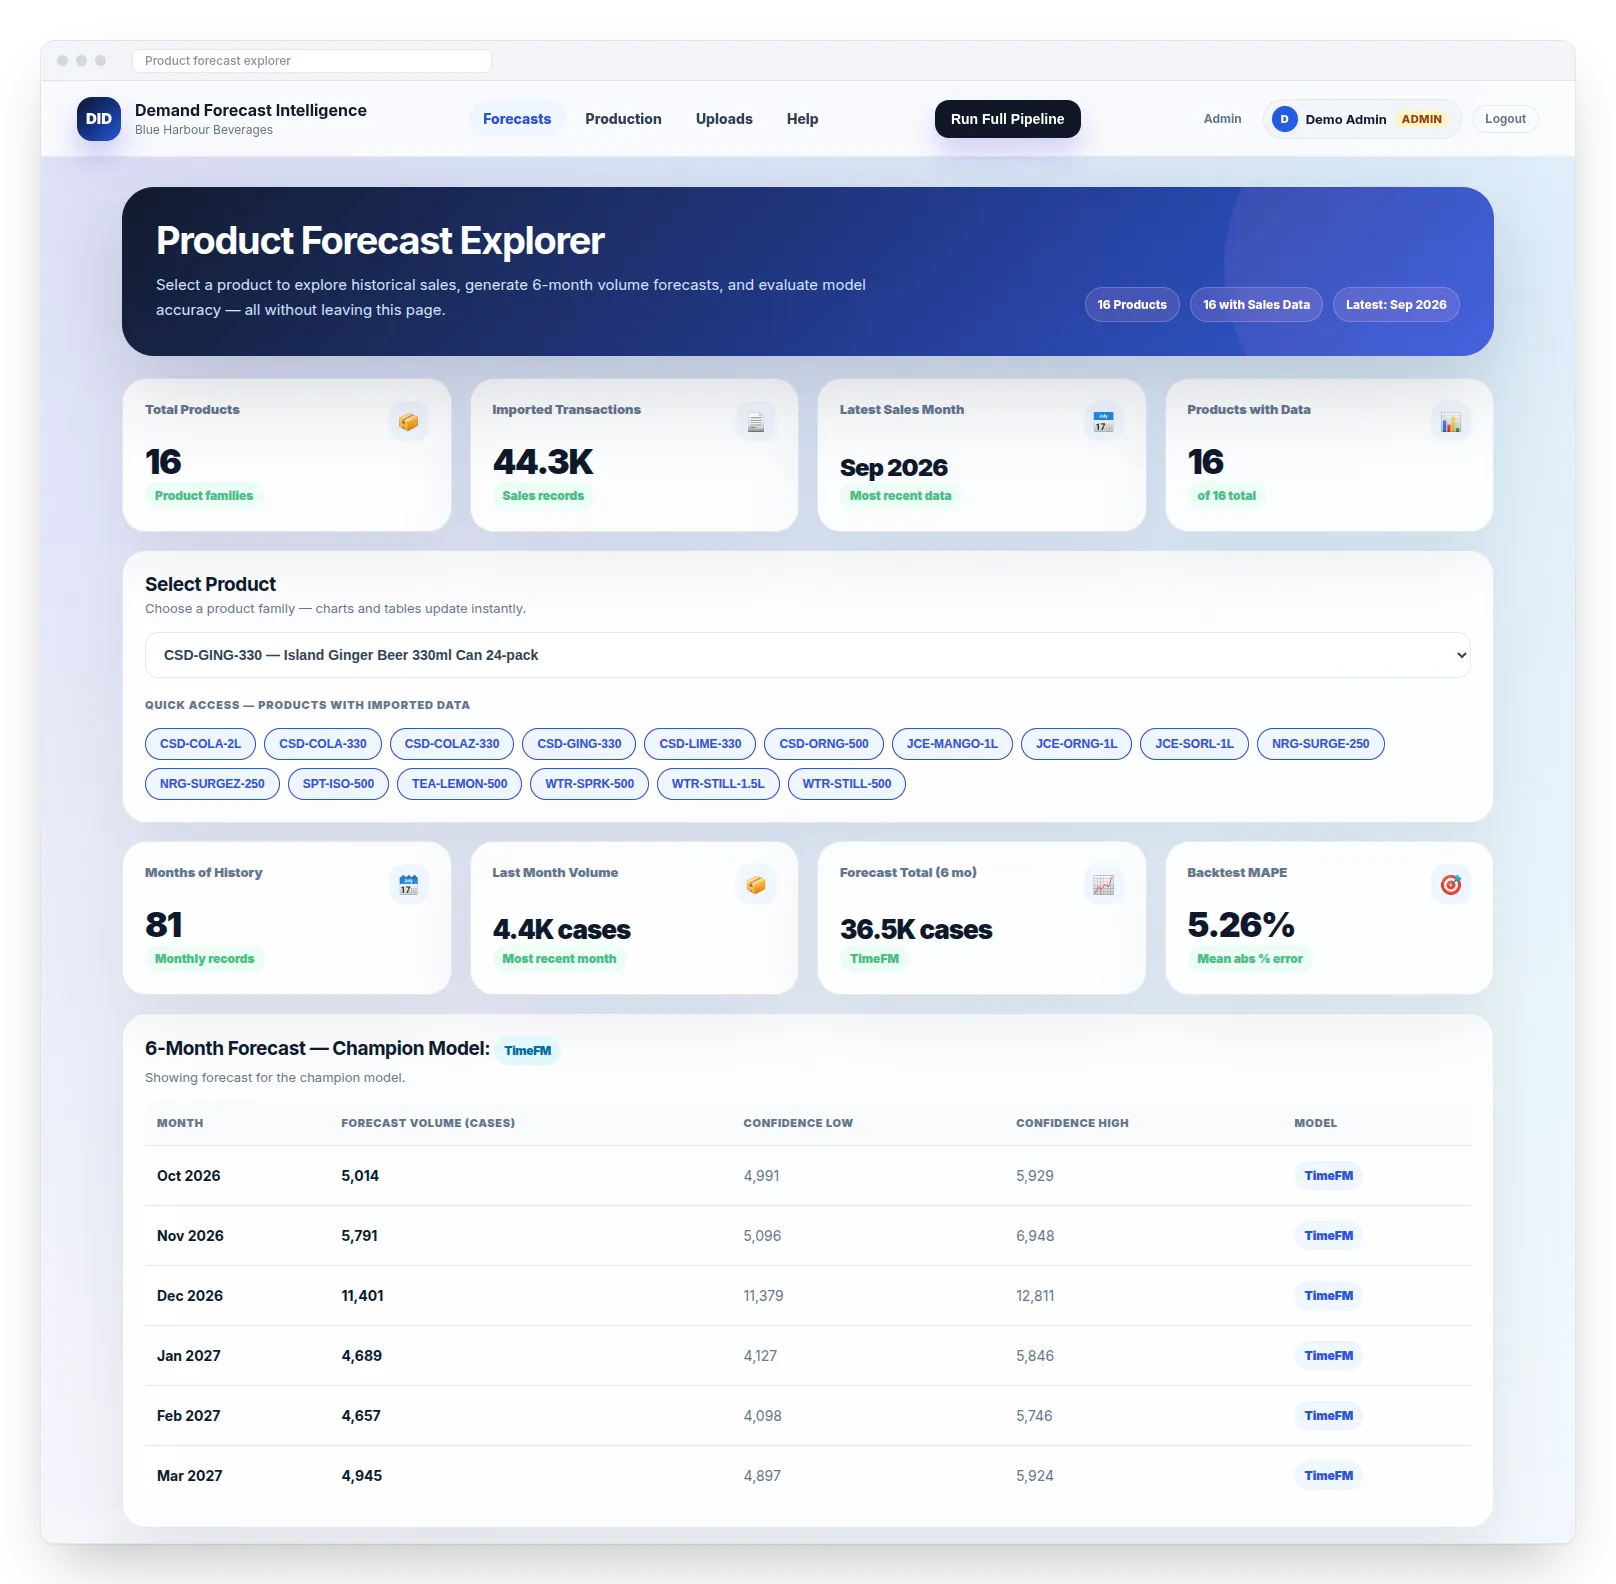
Four machine-learning models compete to forecast demand for every product. The most accurate one wins, and its forecast drives production and raw-material planning.
AI-Powered Dashboards: common questions
Have a question that isn’t here? Ask our team.
What is an AI-powered dashboard?
It is a live business dashboard with AI added on top. The AI explains changes in plain English, answers questions about your data and flags unusual results automatically.
Which systems can you connect?
Most modern systems with an API or database, including ERPs, CRMs, accounting tools, e-commerce platforms, spreadsheets and custom applications.
Do we need a data warehouse first?
No. If you need one, we set up a lightweight one as part of the project. Many dashboards start with direct connections.
Can we use Power BI or our existing BI tool?
Yes. We can build in your current tool or recommend one that fits your budget and team.
How accurate are the AI answers?
The AI only reads from your verified data and shows the numbers it used, so answers can always be checked.
Related services
AI Solution
AI Integration
Connect AI to the systems you already use (CRM, ERP, help desk, e-commerce) without replacing them.
Learn moreAI Solution
AI Process Optimization
Find the slow, costly steps in how work gets done, then redesign them with AI and automation.
Learn moreEngineering Service
Web & Mobile App Development
Custom web apps, portals and iOS/Android apps, built to scale with your business.
Learn more
Let’s talk about AI-Powered Dashboards.
Tell us about your website, app, AI idea or product. We’ll reply within 1 business day with practical next steps.